Web Performance Fundamentals
My key takeaways from Todd Gardner's Frontend Master's workshop.
I recently completed a workshop on Frontend Masters, and this blog post will serve as a repository for my key takeaways, baseline understanding, and overall reference guide to the fundamentals of web performance.
Shout out to Todd Gardner for that awesome workshop. A lot of the stats, if not all of the ones I mention, can be found in his slide deck! Here are his slides.
A Shared Understanding
Before we can even begin talking about performance, we need to align as developers on what performance pertains to in the context of the web. For our purposes, we can think of performance as the speed and efficiency with which a web page loads, renders, and responds to interactions from visitors.
Now, the next thing we need to establish is why performance matters. Performance impacts our user experience (which is important because if our users aren’t happy, then our revenue will suffer), and it can also affect our search engine rankings, as page speed is a known ranking factor for Google, and lastly, it can impact our online advertising — if our pages are slow to load, we may lose potential customers before they even see our ads and each ad therefore becomes more expensive for our ad sponsors.
In fact, WPO Stats is a collection of several different case studies that demonstrate the impact of performance on user experience and business metrics. If you don’t have time to go through any of the case studies, I’ll leave you with this statistic… 40% of users abandon a site at 3 seconds of loading 🫢. So you can see how crucial it is to optimize our web performance, since a slow site equates to lost potential revenue and — the thing I care a lot about — subpar user experiences.
But, what does “fast” really mean? Who defines “fast”? I’ll give you a hint, it’s not you 😆! Fast is a subjective measure that can vary greatly depending on the context. But for our purposes, the people who define “fast” are our customers, our competitors, and search engines.
People - We’re Imperfect
When it comes to our users, there’s a fundamental truth you have to realize about folks — they have shoddy memories. If the actual time it takes for something to occur is 10 seconds, they might perceive it as 20 seconds, and when they’re recounting it to their friends, they’ll remember it as 30 seconds. And so, we can see that perceived performance and not making our users wait is critical for our success. However, people are people and therefore can be understood, at least somewhat, via the lens of psychology.
Not all waiting is the same kind of waiting. For example — and keep this list in mind when you’re doing anything — the following things factor into how “slow” or “fast” a wait feels to a person.
- ⏳ People want to start, so if you make them wait to start, it feels slow.
- 😴 If people are bored, waiting feels slower.
- 😬 If people are anxious, waiting feels slower.
- 🤔 Unexplained waiting feels slower.
- 🕰️ Uncertain waiting feels slow — tell them how long a thing could take.
- 🏆 People will wait longer for high-value things — think about your mortgage application; you’d wait 30 seconds to a minute for that bad boy since it’s so damn important.
Our Competitors
When it comes to speed, there’s an adage that’s apt for when trying to determine if you’re “fast enough”. When a gazelle is running from a lion, it doesn’t have to be the fastest gazelle, it just has to be faster than the slowest gazelle. A similar parallel can be drawn to our competitors, albeit much less morbid. In the context of web performance, you don’t have to be the fastest site on the internet, you just have to be faster than your slowest competitor. This means keeping an eye on your competitors’ performance and ensuring that you’re at least keeping pace, if not surpassing them.
Moreover, we need to keep Weber's Law in mind. Weber’s Law states that the perceived difference between two stimuli is proportional to the magnitude of the stimuli.
Basically, we need a 20% difference in performance to make a noticeable impact on user perception. So what’s that mean practically?
If we’re Target and our website is loading in at 3 seconds and our competitor is loading in at 2.7 seconds,
the difference isn’t that great, from a percentage point of view, so we’re probably fine being at 3 seconds.
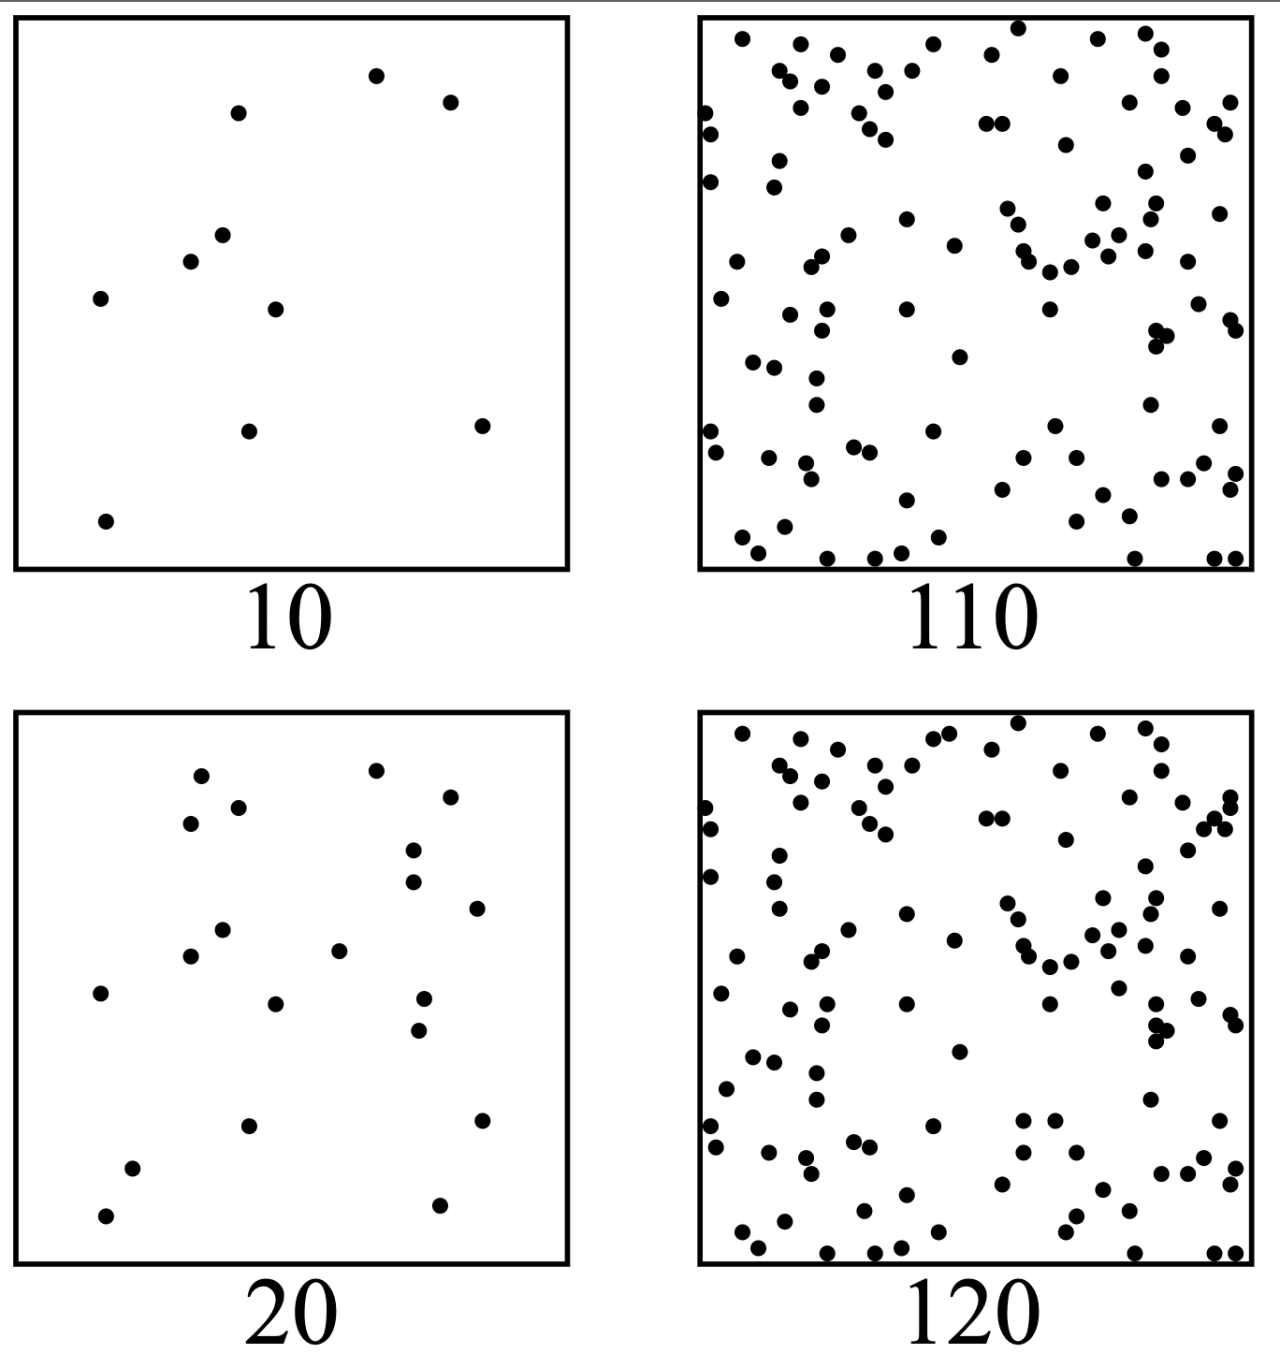
As shown in the above image, the magnitude of the change is the same between the two scenarios, we are increasing the total count by 10, however, the percentage difference is quite different. In the first example, we’re going from 10 to 20 and in the second example we’re going from 110 to 120. The first example is a 100% increase, while the second is only a 9.09% increase. Just by looking at these two images, we can tell, that the same absolute change has different perceived impacts based on the context 🤯.
Measuring Things
When it comes to improving something, I’m a big believer that you need to be able to measure it! If I want to track whether or not I’m getting stronger in the gym, I need to keep track of how much I’m lifting over time — otherwise, how do I know if I’m improving?! When it comes to web performance, the same principle applies. We need to measure our performance metrics to understand where we stand and how we can improve. The bread and butter charts used for measuring web performance are waterfall charts and flame charts (which are indeed intimidating).
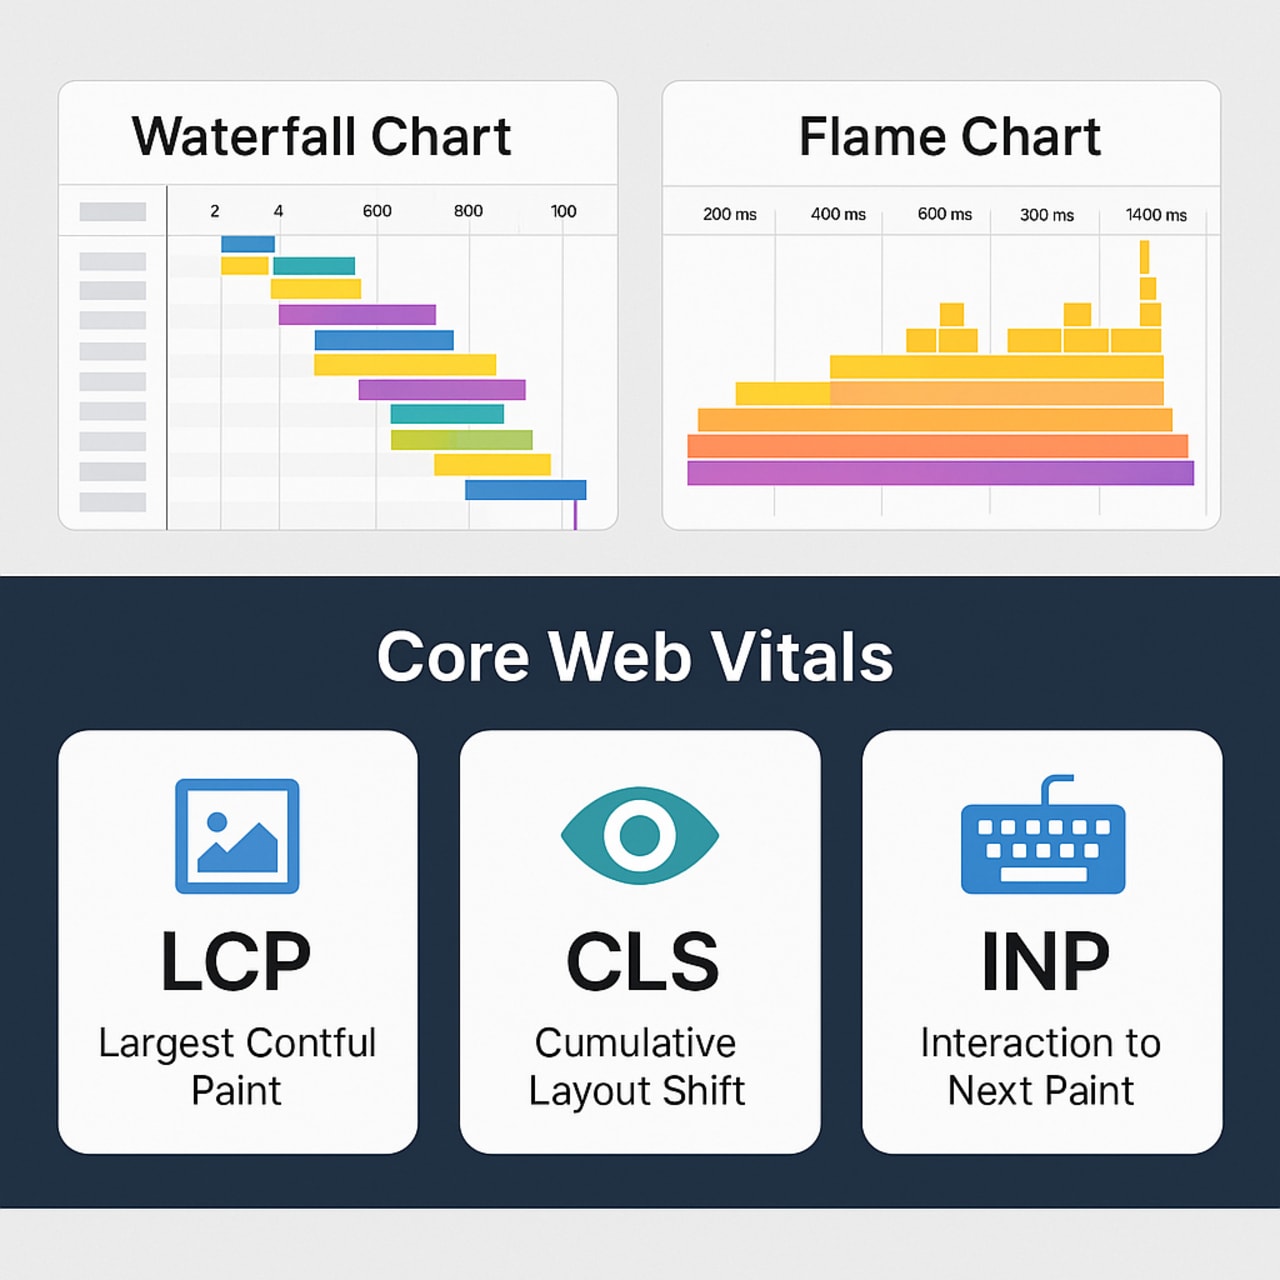
In the pre-single page application (SPA) era, developers relied on load and DOMContentLoaded events to gauge performance. With client-side rendering, these became less representative—initial HTML was often minimal, and much of the UI was built in-browser. Today, we focus on Core Web Vitals, a set of metrics that measure real-world loading, interactivity, and visual stability. They matter for both user experience and Google Search rankings.
At a high level, the core web vitals are:
- 🖼️ Largest Contentful Paint (LCP): how fast the largest visible element loads in. This tends to be images, videos, css background images, text elements. Basically, how fast your site visibly loads.
- 👀 Cumulative Layout Shift (CLS): how smoothly and predictably do elements load in the page. This is important because unexpected shifts can lead to a poor user experience. Also, this is why you see loading skeletons all over the place, they help prevent layout shifts.
- ⌨️ Interaction to Next Paint (INP): how responsive your page is to user interactions (keyboard, clicks, but not scrolling). Basically, how quickly users can interact with the page.
- 👾 Other metrics:
- First Contentful Paint (FCP): what’s the first time we’ve shown the user something; how fast our site shows something.
- Time to First Byte (TTFB): measures the time it takes for the browser to receive the first byte of data from the server after a user requests a page.
Note: I’m not going to discuss the Performance API in this post, but it’s worth noting that the Performance API is a powerful tool for measuring web performance inside the browser.
Testing
When it comes to testing your web performance, it’s important to establish where you want to test from. The options you have to choose from are the lab (simulated environments) and the field (real user environments). Most folks tend to lean on the lab for initial testing due to its controlled conditions, but the field provides invaluable insights into real-world performance.
Testing is also where we start caring about statistics 📊! I know, I know, statistics aren’t really linked to testing or measuring, but they are needed to help analyze the data we’re tracking — and if you’re like me, I have a hard time understanding stats 😅.
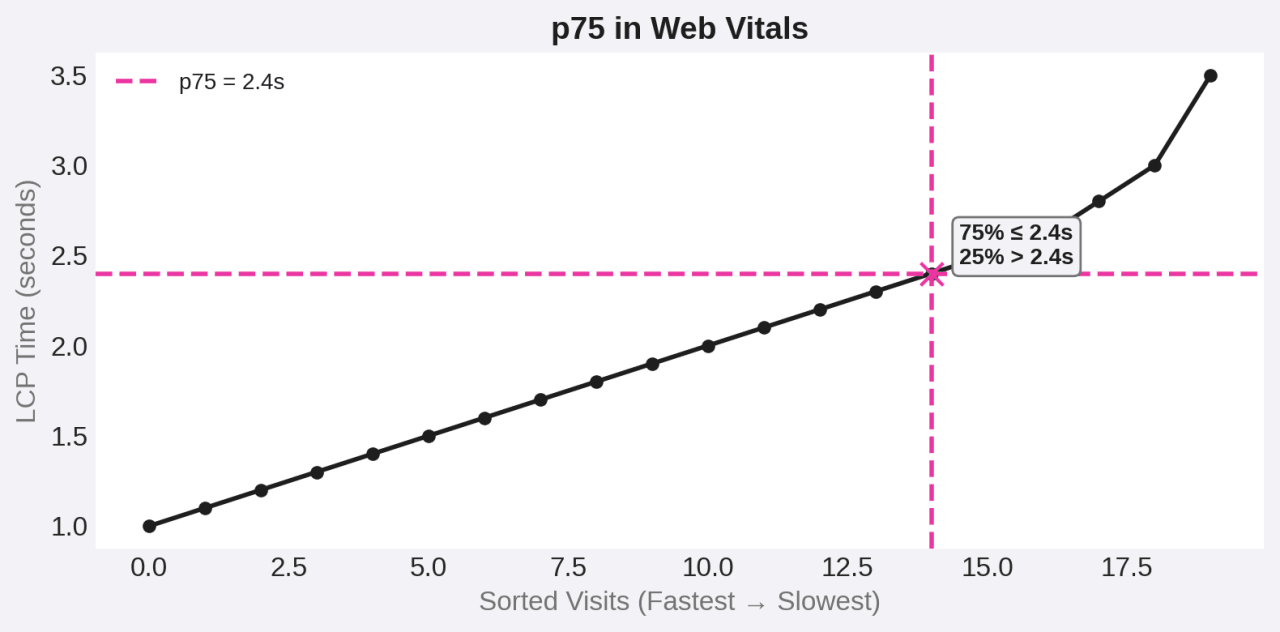
When measuring user experience, we look at percentiles, not averages. Percentiles show the cutoff where a certain percentage of values fall below; averages just add everything up and divide by the count. Percentiles reveal the spread, averages show the middle. So when I say p75 in web performance, I mean the 75th percentile — 75% of visits are faster than that threshold, 25% are slower.
Tools
For gathering lab data, we can use tools like:
For local testing, as I mentioned, we can use Lighthouse! It’s baked into our browser’s DevTools, assuming you’re using a Chromium based browser, making it super convenient to run audits on your web pages. Note: having your dev tools open impacts the test results. Make sure that you undock your dev tools so that your test run isn’t impacted.
Setting Goals
Alright, so this is going to seem painfully obvious, but I have to state it nonetheless. We can’t go around trying to fix everything. We do not have an infinite amount of time to improve our web vitals, and to be frank, it might not even be necessary.
We need to purposefully set goals
As mentioned above, fast is a subjective user perception. For different groups, fast means different things. And with all that being said, I’m trying to hammer home the idea that we need to purposefully set goals. For example, if we are able to see a correlation between our business metrics and web vitals, maybe it’s worth looking into said web vitals. For instance, say the conversion rate on our e-commerce store dips whenever there’s a huge increase in CLS, maybe that’s worth looking into? I’m not necessarily saying that a bad CLS score is causing the dip in conversion but it is worth investigating for sure.
In addition to investigating the business impact of our web vitals, don’t forget about Weber's Law! In order for our customers
to take notice of a difference in our site’s performance, whether they’re comparing with our old site or our competitors,
a minimum of a 20% difference is what is required.
Improving
Let’s jump into the meat 🍖 and potatoes 🥔 of this post! Let’s talk about how to make some gains 💪! For anyone reading this later (including myself), try to keep the following in mind:
- 🧘 Focus on the easiest fixes for your worst metrics from real user data, where possible.
- 🤔 Don’t try to do everything. Sometimes we’re fast enough.
- ⚡ The most basic rule of performance… do fewer things.
Time to First Byte (Ttfb)
When it comes to improving our web vitals, TTFB is the one metric that isn’t necessarily impacted with how our code is written but rather how it’s delivered to our users — this is the operations side of the performance question 🛣!
One of the most basic things we can do is ensure that we are sending content via a compression algorithm like Brotli or gzip. Additionally, using a Content Delivery Network (CDN) — a hopefully geographically distributed network of servers that cache and serve content closer to our users. In addition to offloading work from our own internal servers, it hopefully reduces latency and speeds up delivery of content to our users!
Utilizing efficient protocols when delivering our content will also improve our TTFB! Refer to the below table.
| Feature / Constraint | HTTP/1.1 🚗 | HTTP/2 🚅 | HTTP/3 ✈️ |
|---|---|---|---|
| Transport | TCP | TCP | QUIC (UDP) |
| Request Handling | Sequential; multiple TCP connections needed | Multiplexed streams over a single TCP connection | Multiplexed streams over QUIC with no TCP “head-of-line” blocking |
| Parallel Requests Limit | ~6–10 TCP connections per domain | Usually 1 connection per domain; streams limited by server (10–100 typical) | 1 QUIC connection per domain; streams limited by server (often >100) |
| Head-of-Line Blocking | Yes (per connection) | Yes (per TCP connection, affects all streams) | No (independent streams over QUIC) |
| Header Compression | None (except gzip for body) | HPACK | QPACK |
| Encryption | Optional (HTTP or HTTPS) | Usually HTTPS by default | Always HTTPS |
| Setup Time | TCP handshake + optional TLS handshake | Faster TLS (fewer round trips) | Fastest (0-RTT possible) |
| Fallback | Works everywhere | Falls back to 1.1 | Falls back to 2 or 1.1 |
| Best Use Today | Legacy systems | Widely adopted, works for most modern sites | Growing adoption, best for high-latency or mobile-heavy traffic |
The TLDR of that table, if you didn’t go through it 😅:
| Protocol | Analogy | Description |
|---|---|---|
| HTTP/1.1 🚗 | Single-lane road | One car at a time. |
| HTTP/2 🚙 | Multi-lane road | Many cars, but if one crashes, traffic slows. |
| HTTP/3 🚀 | Smart multi-lane road | If one crashes, others keep moving. |
So, if you’re having issues with TTFB, look at how you’re delivering content to your users and talk to your ops engineers — if you have ops engineers that is 👀!
First Contentful Paint
First Contentful Paint (FCP) is how fast our site loads something — anything really. CSS and Fonts are render blocking by default so when you’re including those types of assets, they prevent the page from rendering until they complete. This is why minification 📰 and bundling 🎥 are important for these kinds of assets! The faster we enable the browser to parse and interpret the rules, the faster our page will render.
What’s important for this particular web vital is starting the download of our critical path resources as soon as possible.
What we want to do here is utilize strategies like preloading resources wherever possible. The following can be preloaded via the
link tag:
- style
- script
- image
- font (CORS)
- fetch (CORS)
We can remove resources from that critical path via lazy loading. Lazy loading is a strategy that amounts to
loading in resources only as they are needed, think a user scrolling or perhaps after a button press, loading in some
JS code from our server.
By default, JavaScript is parser-blocking: when the browser encounters a script,
it halts HTML parsing and delays rendering until that script has been fetched, parsed,
and executed on the main thread. In order to halt this parser blocking behavior, we can utilize the
defer and async attributes on our <script> tags.
-
🎲 Async — Downloads in parallel with HTML parsing, executes immediately when downloaded, pausing parsing. Execution order is unpredictable.
<!-- Example: async script --> <script src="analytics.js" async></script> -
⏳ Defer - Downloads in parallel with HTML parsing, executes after parsing is complete, right before DOMContentLoaded. Execution order is preserved.
<!-- Example: defer script -->
<script src="main.js" defer></script>
Largest Contentful Paint
Largest Contentful Paint (LCP) tends to be an image or video resource. So the question is, how quickly can that resource load and render? That’s why TTFB and FCP matter — the faster the browser can get and start painting the main content, the better our LCP score will be.
The components of LCP are resource delay, resource duration, and render delay. The tactics we
can use to improve our LCP score are even more lazy loading, eager loading, and optimizing our images! Did
you know that images and iframes accept a loading attribute? Well, they do ⚡, so we can set this
equal to lazy and get some performance gains.
For LCP, we can also utilize eager loading, the idea of loading critical path resources as soon as possible. This can be
accomplished by, assuming the resource is an image or something to that effect, using a <link> tag to preload our image asset…
<link ref="preload" as="image" href="/assets/someimage.png"> or by setting a fetchpriority on our important
img elements… <img fetchpriority="high" src="/assets/someimage.png" />!
Another great tactic is compressing our images and only sending the bytes truly necessary for rendering our resources at an acceptable quality level. You might be saying, but bro 🤨, didn’t we already talk about compressing via Brotli or gzip, so why would I need to compress my images further?
The key difference is that Brotli and gzip are text-based compression algorithms. They’re awesome for HTML, CSS, and JavaScript because those files are just text, which compresses really well. Images, on the other hand, are already stored in compressed formats like JPEG, PNG, or WebP. Running them through gzip won’t magically shrink them more — in fact, it usually does nothing 😅.
That’s why we need image-specific compression: things like resizing to responsive breakpoints, serving WebP/AVIF, stripping out metadata, and dialing in quality settings. These steps cut actual image bytes, which is often the biggest win for Largest Contentful Paint (LCP).
| Format | Compression | Typical Size 📦 | Quality 🖼️ | Browser Support 🌐 | Best Use Case |
|---|---|---|---|---|---|
| JPEG 📸 | Lossy | Medium–Small | Good, but can show artifacts | Universal ✅ | Photos, complex images |
| PNG 🖌️ | Lossless | Large | Excellent (no artifacts, supports transparency) | Universal ✅ | Logos, icons, images needing transparency |
| WebP 🚀 | Lossy/Lossless | Smaller than JPEG/PNG | High (supports transparency + animation) | Widely supported (not IE) | General purpose replacement for JPEG/PNG |
| AVIF 🌈 | Lossy/Lossless | Smallest | Excellent (HDR support) | Growing (all modern browsers) | Cutting edge for photos, hi-res graphics |
We can also utilize responsive images to help improve our LCP.
It makes no sense to serve a 2800px-wide image to a mobile device with a 600px screen.
Instead, we can use the srcset attribute to define multiple image sources at different sizes.
The browser will automatically choose the most appropriate file based on the user’s screen resolution and viewport size.
For even more control, we can wrap our images in the <picture> element, which allows us to serve
entirely different images for different scenarios
(for example, a cropped image on mobile and a wide landscape version on desktop).
<picture class="my-0 aspect-[12/8] w-full">
	<!-- ≤600px screens → 480w (small phones) -->
	<source
		media="(max-width: 600px)"
		srcset="
			https://res.cloudinary.com/dinypqsgl/image/upload/f_avif,c_scale,w_480/v1743637882/blog/18-embla-carousel/embla-carousel_yyma9f.png 480w
		"
		type="image/avif"
	/>
	<source
		media="(max-width: 600px)"
		srcset="
			https://res.cloudinary.com/dinypqsgl/image/upload/f_webp,c_scale,w_480/v1743637882/blog/18-embla-carousel/embla-carousel_yyma9f.png 480w
		"
		type="image/webp"
	/>

	<!-- 601–1080px screens → 800w (large phones / small tablets) -->
	<source
		media="(max-width: 1080px)"
		srcset="
			https://res.cloudinary.com/dinypqsgl/image/upload/f_avif,c_scale,w_800/v1743637882/blog/18-embla-carousel/embla-carousel_yyma9f.png 800w
		"
		type="image/avif"
	/>
	<source
		media="(max-width: 1080px)"
		srcset="
			https://res.cloudinary.com/dinypqsgl/image/upload/f_webp,c_scale,w_800/v1743637882/blog/18-embla-carousel/embla-carousel_yyma9f.png 800w
		"
		type="image/webp"
	/>

	<!-- >1080px screens → 1280w (desktops) -->
	<source
		srcset="
			https://res.cloudinary.com/dinypqsgl/image/upload/f_avif,c_scale,w_1280/v1743637882/blog/18-embla-carousel/embla-carousel_yyma9f.png 1280w
		"
		type="image/avif"
	/>
	<source
		srcset="
			https://res.cloudinary.com/dinypqsgl/image/upload/f_webp,c_scale,w_1280/v1743637882/blog/18-embla-carousel/embla-carousel_yyma9f.png 1280w
		"
		type="image/webp"
	/>

	<!-- Fallback: original PNG (will be used by non-AVIF/WebP browsers) -->
	<img
		class="mx-auto my-0"
		alt="An image of an AI-generated carousel"
		src="https://res.cloudinary.com/dinypqsgl/image/upload/c_scale,w_1280/v1743637882/blog/18-embla-carousel/embla-carousel_yyma9f.png"
		fetchpriority="high"
		decoding="async"
	/>
</picture>
Another thing I’ll touch upon is invoking an effective caching strategy. We want to improve the return experience for our users wherever possible. This means considering caching at all layers of the stack, starting with our server, CDNs, and our users’ browsers themselves. I won’t touch upon this too much here because, like much of what I discussed already, caching is something that can be discussed at length by people far more qualified than I 😅. Here’s a great talk by my friend Kent that touches upon the topic.
Cumulative Layout Shift and Interaction to Next Paint
Last but not least, let’s cover our other two metrics. We’ve improved TTFB, FCP, and LCP — but if you’ve lazy-loaded a bunch
of resources, you’ve probably traded off against cumulative layout shift (CLS).
The fix is simple: give your <img> tags proper width and height attributes. These don’t need px units;
the browser just uses them to preserve aspect ratio and avoid jank while images load.
If elements pop in dynamically, prevent layout shifts by absolutely positioning them, or by reserving space with placeholder UI (like skeleton loaders).
Finally, Interaction to Next Paint (INP)
measures how fast users can interact — clicks, taps, typing.
To improve INP, yield to the main thread. In practice, this means breaking up long tasks by moving work into the
callback or microtask queues, typically with setTimeout or requestAnimationFrame.
// Bad: Long-running task
function processItems(items) {
	for (let i = 0; i < items.length; i++) {
		heavyComputation(items[i])
	}
}

// Good: Chunked processing
function processItemsChunked(items, index = 0) {
	const CHUNK_SIZE = 10
	const end = Math.min(index + CHUNK_SIZE, items.length)

	for (let i = index; i < end; i++) {
		heavyComputation(items[i])
	}

	if (end < items.length) {
		setTimeout(() => processItemsChunked(items, end), 0)
	}
}
Conclusion
At the end of the day, web performance isn’t about chasing perfect scores — it’s about respecting your users’ time. Shave off the waste, fix the biggest pain points first, and remember: fast is subjective and you’re not the one defining that “fast” means — it’s your users.
So what are you waiting for? Run PageSpeed Insights on your site and get to work improving your worst metric 🤝!
Hope this was worth your time.